
The Film Room
November 1, 2026 · Pete Macias, Dark Reel Studios
What Is EPA in Football? Expected Points Added, Explained for Fans
A 6-yard run on 3rd-and-5 and a 6-yard run on 3rd-and-8 look the same in the box score. One keeps the drive alive. The other usually ends in a punt. Yards can't tell them apart. EPA, or expected points added, can.
That's why you hear it on broadcasts, see it in betting previews and read it in every analytics thread. Here's what it means, in plain football terms.
What is EPA in football?
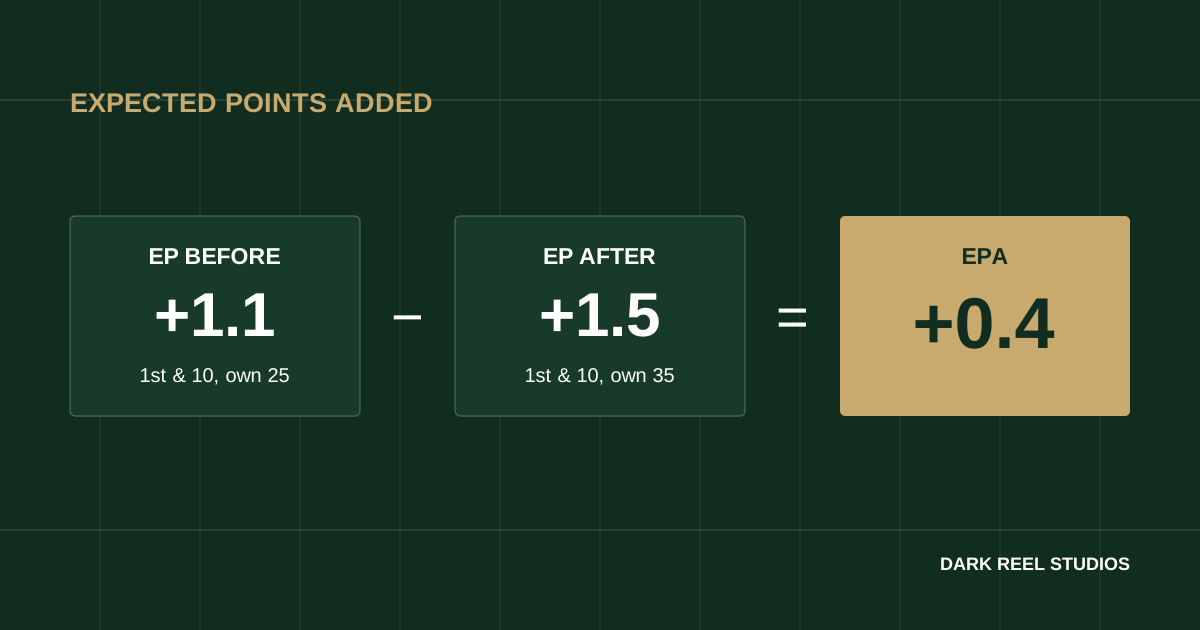
EPA (expected points added) measures how much a single play changes a team's expected points. Before every snap, the situation (down, distance, field position, time left) is worth a certain number of points on average. After the play, the new situation is worth a different number. The difference is the EPA.
EPA = expected points after the play − expected points before the play
That's the definition used by nflfastR, the open-source play-by-play project that powers a lot of the public NFL analytics you see. A positive EPA means the play improved the offense's scoring outlook. A negative EPA means it hurt it. As PFF's metrics explainer puts it, EPA values each play "by the effect it has on the offense's likelihood to score."
First, what are expected points?
Expected points (EP) answer one question: from this exact spot, how many points is this possession worth on average?
Models look at thousands of past plays from the same kind of situation and ask what the next score was, and who got it. A touchdown for the offense counts as +7, a field goal +3, and a score by the other team counts against them. Average all of that and you get expected points. The nflfastR model uses down, yards to go, yard line, seconds left in the half, timeouts, home field, roof type and era, according to Ben Baldwin's write-up of the nflfastR models.
Field position matters most. We pulled every 1st-and-10 snap from the 2025 NFL regular season in the nflverse play-by-play data and averaged the model's expected points by yard line:
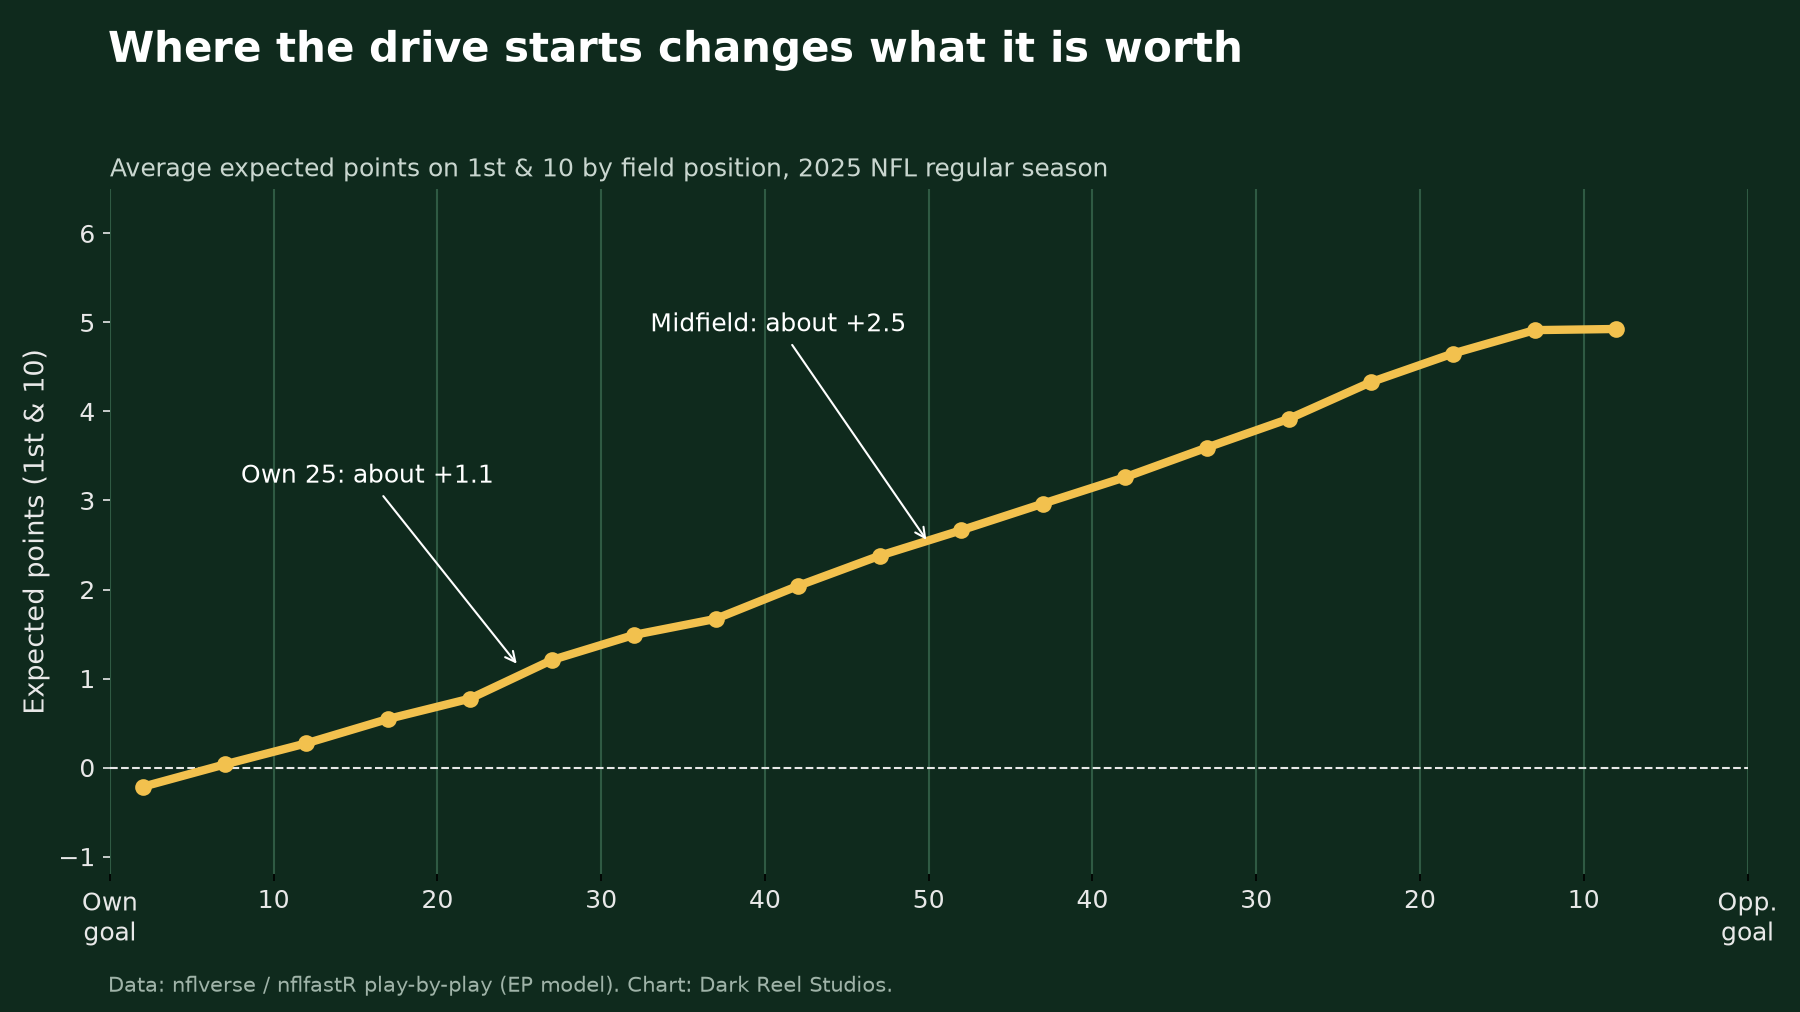
- 1st-and-10 at your own 25: about +1.1 expected points
- 1st-and-10 at midfield: about +2.5
- 1st-and-10 at the opponent's 20: about +4.5
- 1st-and-10 backed up at your own 1: about −0.5 (the next score is more likely to be the other team's)
Down and distance matter too. Near midfield in 2025, 3rd-and-1 was worth about +2.2 expected points. 3rd-and-10 from the same area was worth about +1.3. Same yard line, almost a full point apart, because one is a likely conversion and the other is a likely punt.
How is EPA calculated? One play, step by step
Take a 10-yard completion on 1st-and-10 from your own 25.
1. Before the snap: 1st-and-10 at your own 25 is worth about +1.1 expected points. 2. After the play: 1st-and-10 at your own 35 is worth about +1.5. 3. EPA: 1.5 − 1.1 = about +0.4.
Now flip it. Same 10-yard gain, but on 3rd-and-12. The offense comes up 2 yards short and has to punt, so the next snap belongs to the other team. That play gained yardage but lowered the offense's expected points, so its EPA is negative. Ten yards, two very different plays. That's the whole point of the stat.
(Numbers are rounded averages from the 2025 season. Live models adjust for time, timeouts and more, so broadcast numbers will differ a little.)
What does EPA per play mean?
Single plays are noisy, so analysts add them up and divide by the number of plays. EPA per play tells you how much value an offense (or quarterback, or defense) creates on an average snap. PFF notes that discussing EPA per play is common practice because it evens out differences in how many plays teams run.
- Offense: higher is better.
- Defense: the EPA an offense gains is EPA the defense gives up, so for a defense, lower (more negative) is better.
What is a good EPA per play?
Because expected points are built from league-wide averages, the league-wide average EPA per play sits close to zero. In our pull of the 2025 regular season (pass and run plays only, nflverse data):
- All dropbacks (passes, sacks, scrambles): about +0.04 EPA per play
- All designed runs: about −0.05
- Best offense (Patriots): about +0.16
- Worst offense (Raiders): about −0.22
A rough way to read it: anything above +0.10 per play is a strong offense, around 0 is average, and below −0.10 is a struggle. Treat those as rules of thumb, not official cutoffs.
Notice the gap between passing and running. On average, a pass play created more value than a run play in 2025. That gap is one reason analysts keep pushing teams to throw more on early downs.
EPA vs. success rate
You'll often see success rate next to EPA. In nflfastR's glossary, success rate is simply the percentage of plays with positive EPA.
- EPA per play rewards big plays. One 60-yard touchdown can carry a whole afternoon.
- Success rate rewards staying on schedule. It asks how often the offense "won" the snap, no matter by how much.
An offense with a great EPA but a low success rate is living on explosives. An offense with a high success rate but modest EPA is grinding. The best offenses do both.
Where did expected points come from?
Not from Silicon Valley. In 1971, Virgil Carter, then an NFL quarterback with the Cincinnati Bengals, and Robert Machol published "Operations Research on Football" in the journal Operations Research. They charted 8,373 plays from the first 56 games of the 1969 NFL season and estimated what a 1st-and-10 was worth at each spot on the field. Fifty-plus years later, the idea is the same. The models are just a lot better.
College football has its own version too. CollegeFootballData.com publishes the same idea for the college game under the name PPA (predicted points added).
How to use EPA when you watch this weekend
1. Stop grading plays by yards alone. Ask: did that play make the offense more likely to score? 2. Watch third down. Conversions are where EPA swings. A 4-yard catch on 3rd-and-3 is a winning play. A 7-yard catch on 3rd-and-9 usually isn't. 3. Respect the sack. Sacks and turnovers are where EPA falls off a cliff. That's why analysts obsess over quarterbacks who avoid them. 4. Use per-play numbers, not totals. Totals reward volume. Per-play numbers reward efficiency.
Try it during Thursday night's Jaguars at Ravens game, or with the big college slate on Saturday. Pick one drive and guess whether each play was positive or negative EPA. You'll be surprised how often a "good gain" was really a loss.
Keep studying the tape
EPA tells you what happened. Film tells you why. Pair this with our guide on how to read a defense pre-snap, then test yourself with daily football games in The Play Hub. New to the terms? The Dark Reel football glossary has you covered, and the Film Room Playbook and Strategy Guide are in The Store. The Film Room app is free on iOS; search The Film Room NFL Trivia.
See you in the room.
— Pete Macias, Dark Reel Studios
Data note: 2025 figures are Dark Reel calculations from the nflverse/nflfastR play-by-play release (regular season; pass and run plays for EPA per play; 1st-and-10 snaps for the field-position chart). Expected points come from the nflfastR model.